Better Scenario Visualization
As we mention previously, Herogi enables you to design really complex scenarios & workflows. We achieve it by generating a complex state machine for your scenario.
Once you start using Herogi, you have more and more complex scenarios which help you to achieve tons. But this also make it harder to understand and read these complex scenarios.
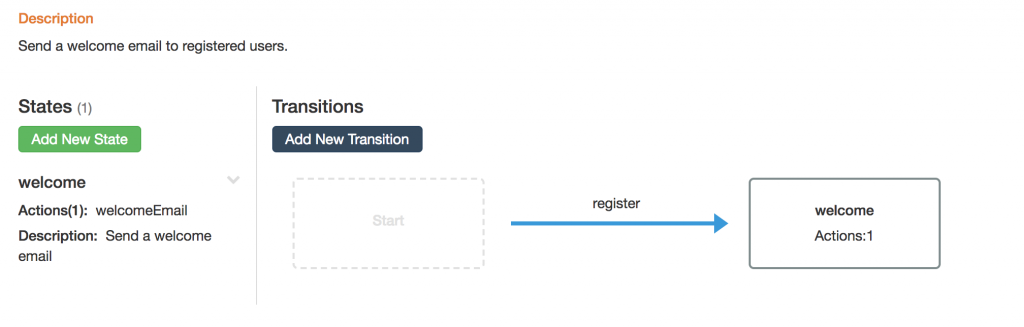
If you have like one to five transitions, it’s easy to follow, as you see;
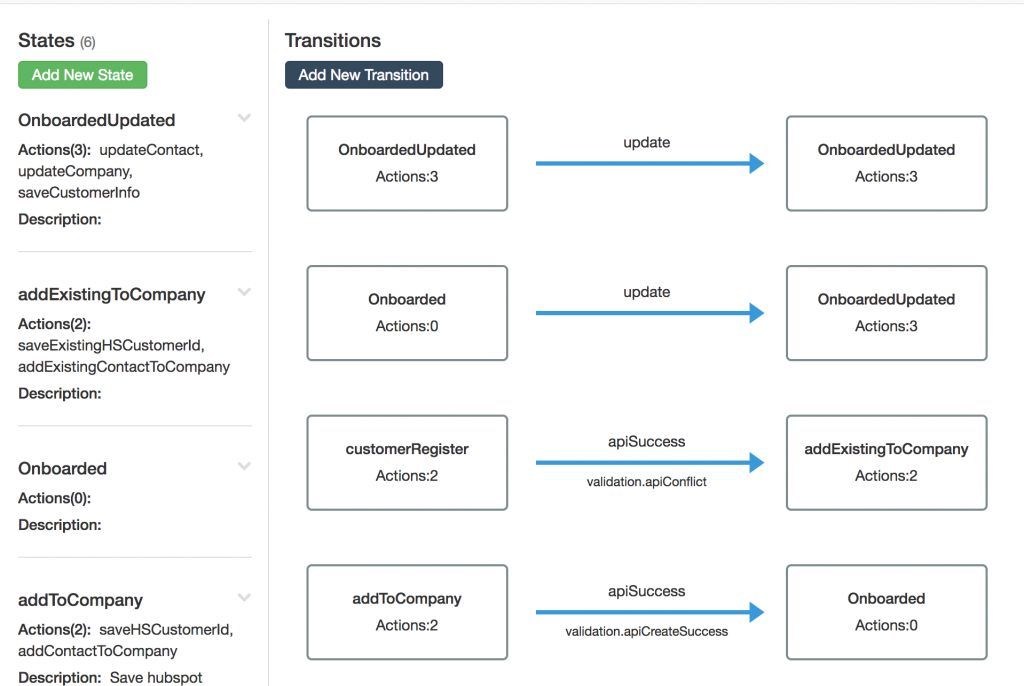
But once you have lots of transitions it’s harder to follow;
We want to make this process as simple as possible for our customers, so that’s why we’re introducing our new beta visualise functionality.
The best way to display a state machine, is actually drawing a state machine. It’s how our brain works, we have better understanding, once we have mind maps generated for complex problems. So we apply same approach for our scenarios.
Now when you visit scenario design page, you’ll see Visualise button on top right of browser. If you toggle that button, transitions and states list will replaced by an editor like this;
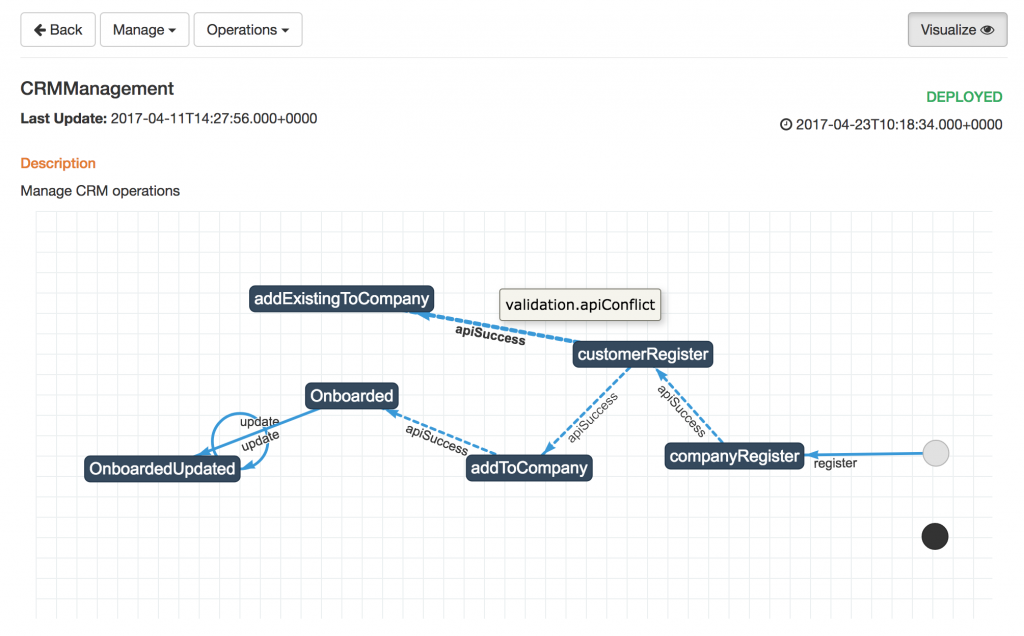
As you see, this is the same scenario which is very easy to follow.
Features
These are the current functionality supported;
– You can drag states to any position
– You can right click and export it as png
– Whenever you change positions of states, it’ll be saved locally in browser cookies. So when you login back, you can find your scenario as you designed.
– Dashed lines show you transition with validations
– Hovering on a state will open tooltip which has actions in that state
– Hovering on a edge will open tooltip which has validation on that transition.
Hope you enjoy using it and please give us feedbacks.